When you look at any group of kids, it becomes instantly obvious that they come in a huge range of shapes and sizes. That is because each child grows at their own rate and there can be a huge range of healthy sizes for kids. Many factors influence a kid’s growth including genetics, nutrition, gender, health, hormones, environment, physical activity and more. Because of the huge ranges involved, doctors use baby growth charts to help determine if a child is healthy and developing appropriately for his age. Read on to learn how to understand the growth charts and when to worry that your baby is not developing properly.
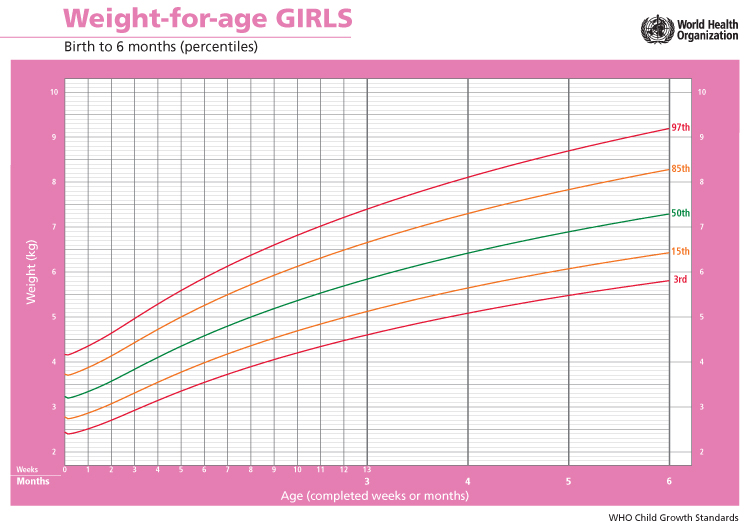
(Image sourced from World Health Orgnization)
Understanding Baby Growth Chart
1. Why Are Baby Growth Charts Needed?
Growth charts are crucial for any regular checkup because they show the doctor how children are growing in comparison with their peers of the same gender and age. It also gives doctors an easy way to check your child’s growth patterns over time to make sure he develops proportionally.
If, for example, your child follows the same growth pattern until he is two and then it suddenly decreases, your doctor may decide to check for health problems that can cause this.
2. What Measurements Are Used in Baby Growth Chart?
When babies are 36 months old or less, doctors will look at growth charts that include length and weight as well as head circumference.
When the child gets older, the doctor will look at height and weight in addition to BMI (body mass index). This comparison helps give the doctor a complete impression of the child’s growth.
3. What Are Percentiles?
Percentiles show how your child grows comparing to others and on growth charts they are shown with lines that follow curved patterns.
When your doctor takes your child’s height and weight and plots them on the growth chart, they will take a look at which percentile line the measurements hit. If a child has a higher percentile number this indicates that he is larger when compared to other children of the same gender and age and this is true whether the chart the doctor is looking at measures of height or weight.
An example is that if a 4 year old boy has a weight in the 20th percentile, 20% of the other children his age and gender weigh less than him. Therefore 80% of 4 year old boys will weigh more than your baby.
4. What’s the Ideal Percentile?
When it comes to growth chart percentiles, there is no ideal number. In many cases a child in the 95th percentile will have the same overall health as one in the 5th percentile.
Instead of an ideal percentile, the ideal situation is that your child will maintain the same growth pattern throughout their development. Ideally their height and weight should grow at the same (or a similar) rate and these measurements should remain proportional to each other. In most cases, this means that a child will stay within the same percentile line throughout their development.
5. Does Lower Percentiles Mean Poor Health?
The most common growth charts that you find in the United States were created by the CDC (Centers for Disease Control and Prevention) and these were most recently updated in 2000. The CDC created the charts based on growth measurement data that was collected from thousands of American children during a period of time. They then took the measurements and made them into one chart that utilizes the percentile curves.
A child’s percentile on a growth chart doesn’t indicate that they are healthier or less healthy than their peers and it doesn’t even indicate a weight or growth problem. If, for example, the four year old mentioned above is the 10th percentile for his weight (instead of the 20th) and is also in the same 10th percentile for his height, this simply means that he is smaller than his average peers. The fact that 90% of them weight more than him and are taller does not indicate a health problem and in most cases where the child shows signs of healthy development, especially when other family members are small, doctors will not have any concerns about this percentile ranking.
6. When Should You Worry?
You should be concerned if your baby experiences a sudden change in percentile such as shifting from the 50th weight percentile to the 15th. This may indicate a medical problem so your doctor will investigate. In some cases smaller drops will be due to a minor illness or a small change in eating habits and in these cases, your doctor will keep a close eye on your baby’s growth but without much concern.
If your baby’s weight gain is slowing despite growing in length and not being sick, your doctor may suggest you feed him more often and have more frequent doctor visits to check on his progress with weight gain. In some cases, however, losing or gaining at a faster rate than normal isn’t an issue.
7. What If Your Child Is on the Extreme Range of Percentile?
In some cases when your baby is on the extreme bottom or top range of the percentile scale, your doctor will follow up. This can be normal depending on your size and that of your family but if family traits can’t explain it, the doctor will check for genetic problems or hormone deficiencies. In the case of weights in the top 5 percentiles, the doctor will probably watch your baby to make sure he doesn’t become obese.
If your baby has a smaller than average head measurement, the doctor may check for brain growth and development and a larger than average measurement may lead to checking for excess fluid in his brain.
8. How Much does Birth Weight Determine Future Growth?
In reality, birth weight doesn’t matter as much as most people think. The main factor is genes instead of birth weight so the best indicator is the size and shape of the baby’s parents. Most children tend to have the same body type and size as their parents.
Final Notes:
Doctors have been using pediatric growth charts since 1977 in the United States for infants, children and even adolescents. The CDC recommends using the WHO growth charts for children under two and the CDC charts for those over two. These charts should not be the sole basis for diagnosis as they are only a tool.
Watch a video for more explanation: understanding baby growth charts
Do you want to make your own growth chart for your baby? Watch how: